What do potholes and electric outages have in common? Like puncturing a tyre when hitting an unexpected pothole, power disruptions can cause emotional and economic havoc. Most South Africans can recall the power crisis of 2015 which disrupted many lives and caused damage to the economy. For most, the power cuts were unexpected and often lead to financial consequences such as replacing damaged home appliances, or psychological effects such as missing their favourite prime time TV show.
Our customers in the Electric utilities industry have realised the value and benefits of improving their Outage Management System to better serve the economy and community at large. By implementing the ArcGIS platform, electric utilities are managing outages by integrating systems and geo-enabling both employees and the public through the power of location.
The utility’s GIS is usually the source of the network model whereby advanced location analytics enables smarter outage predictions and mapping. Eskom is an example of a customer who has embraced the use and benefits of the ArcGIS platform to visualise outages on their electrical network.
In an article published in the November 2016 issue of the PositionIT magazine, Gerhard Brits, Keagen Liebenberg and Shaun Goodbrand from Eskom explained how they leveraged the ArcGIS platform to create a national 2016 voting station outage web mapping application in only 5 days. By consuming information form two separate systems for multiple and single customer outages (FMS and CC&I) the team created links between reported faults and the 22 614 voting stations which allowed them to visualise which voting stations were experiencing outages. ArcGIS for Server was used to host and publish data exposed by desktop and web clients. Portal of ArcGIS was used to control access to the platform and Web AppBuilder for ArcGIS was used to create application-specific tools.
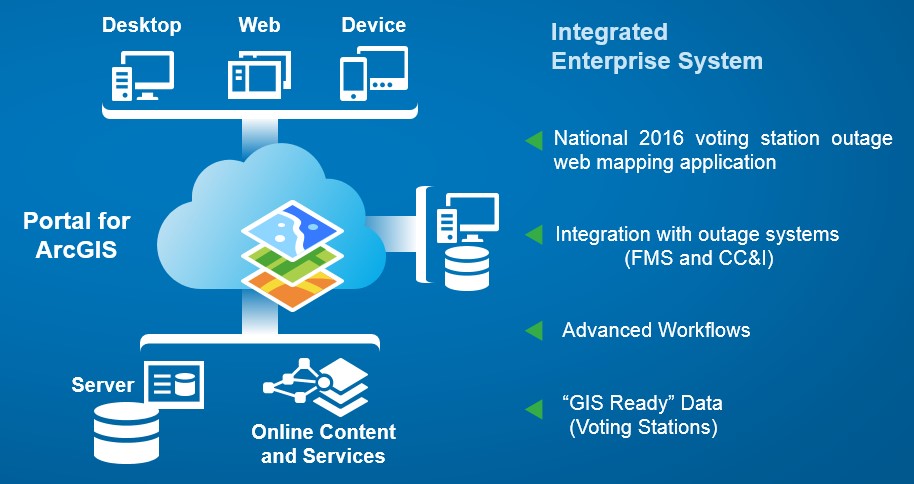
“The combination of these software utilities provides a very agile environment that allows the team to respond to user requirements in a timely manner” – Gerhard Brits.
For more information on this project, see http://www.ee.co.za/article/national-2016-voting-station-outage-map.html#.WHjjI8vRbqA
Esri helps you answer the question of “where” and solve real world problems. You transform your utility operations when you can quickly query, analyse, and understand your data. Esri provides a complete system that allows you to integrate disparate data, access and update information from the office or the field, and maintain a real-time view of all operations. More than maps and applications, Esri gives you the location analytics you need to save time, lower costs, and satisfy customers.
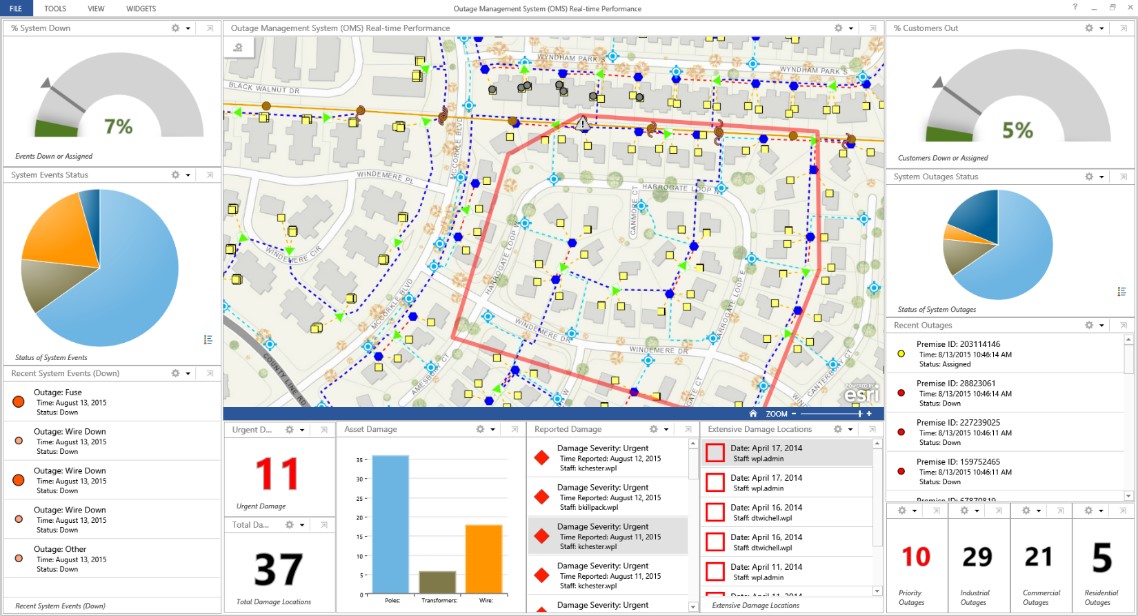
Example of an OMS operations dashboard configured with ArcGIS
Acknowledgements: Gerhard Brits, Keagen Liebenberg and Shaun Goodbrand from Eskom