Example Requirement:
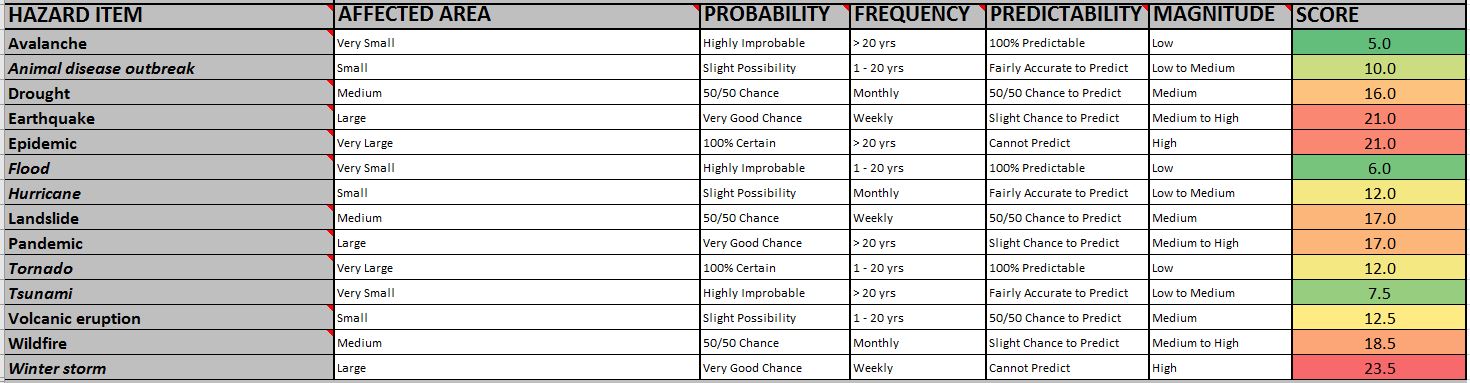
You are being tasked with creating a Disaster Risk Assessment form (as above) which requires the field worker to capture the risk factor associated with 14 Hazard Items:
- Avalanche
- Animal disease outbreak
- Drought
- Earthquake
- Epidemic
- Flood
- Hurricane
- Landslide
- Pandemic
- Tornado
- Tsunami
- Volcanic eruption
- Wildfire
- Winter storm
Each of these Hazard Items require the field worker to assess the risk factors of the hazard as follows:
- Affected Area (Very small=1, Small=2, Medium=3, Large=4, Very large=5)
- Probability (0% chance=1, 30% chance=2, 60% chance=3, 80% chance=4, 100% chance=5)
- Frequency (> 20 years = 1, 1 to 20 years = 2, Annually = 3, Monthly = 4, Weekly = 5)
- Predictability (100% Predictable = 1, Fairly Accurate to Predict = 2, 50/50 predictable = 3, Slightly Predictable = 4, Cannot Predict = 5)
- Magnitude (Low = 1, Low to Medium = 2, Medium = 3, Medium to High = 4, High = 5)
A hazard score is calculated with the above risk factors as follow:
Score = Affected Area*0.5 + Probability + Predictability + Magnitude*1.5 + Frequency
Survey / Feature Class Design:
Having worked with Survey123 before we might be tempted to jump into it and simply create 14 questions, one for each Hazard Item listed in the requirement. The number of attributes quickly escalates however, since we also need to capture the associated Risk Factor for each Hazard Item – which results in a LOT of attributes! That doesn’t sound like a good design anymore, does it?
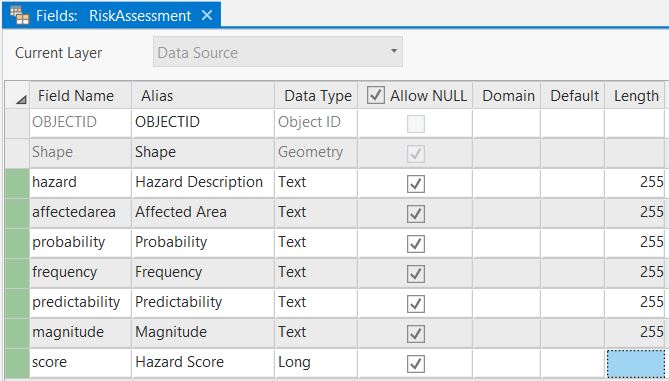
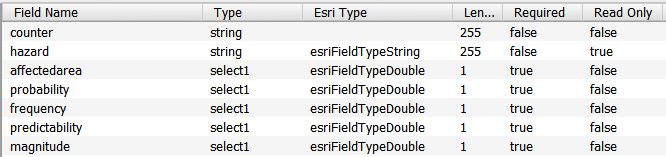
If we first designed this Feature Class in ArcGIS Pro we would probably design it simpler and lighter; perhaps a design like the one below, where each hazard item is not a separate attribute but a generic field which stores the Hazard Item descriptions:
That looks better, but how do we marry these two designs and also keep in mind the “limitations” of Survey123, seeing that Survey123 only allows one answer per “question”? An alternative would be to use a repeat section in the survey. A repeat section would give us the ability to add each Hazard Item as a (related) record whilst saving the Risk Factors in attributes.
Good, a Repeat Section it is… but how do we make it easy for the hapless field worker to capture 14 attributes and then still expect him/her to remember which hazards have been captured and which ones haven’t? It would be downright cruel to have the user choose the hazard item from a drop-down, like this (mistakes will happen!):
Let us improve on this design.
It would be great if the field worker didn’t have to remember which hazard is next in the sequence, so if we can add an auto-incremented hazard list to the design it would be great! It would also be nice if the field worker could see some kind of progress as the survey is completed – for instance Hazard 5 of 14 captured.
Luckily Survey123 allows us to do all of these things. Look at the final design in action:
This solution comprises:
- An auto-incremented Hazard Item (leaving no room for mistakes!)
- An incremented counter showing the capturing progress (for example 1 of 14)
- A clean database design that looks like this:
- A happy field worker!
So how did we achieve this design?
In the repeat section of the survey, add a counter variable (count1) that we use for the increment:
| calculate | count1 | count1 | 1 |
| calculate | counter | Counter | once(count(${count1})) |
The count() function does a count of the number of repeats by simply counting all the count1 values. The once() function ensures that the count calculation only happens once, otherwise we will have an issue when the user traverses backwards through the list and the count() is recalculated.
Now, for the magic bit…
Create a CSV file with all the Hazard Items and their indexes in it. The file will look like this:
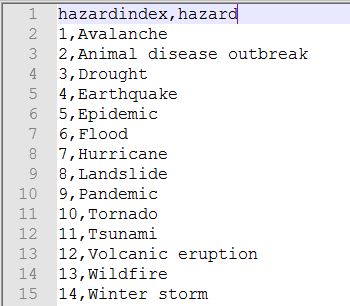
Now all we need is to hook up our incremental index (the ${Counter}) with the Hazard Item. This is done with the pulldata() function as follow, where HazardEntryLookup is our CSV file:
pulldata('HazardEntryLookup', 'hazard', 'hazardindex', string(${counter}))
Now, all that is left is to enable the 1 of 14, 2 of 14, etc functionality. This is done by specifying that the Repeat count should not exceed 14 (our number of hazard items). So setting the repeat_count option for the Repeat sorts that out nicely!
As always, here is the complete set of files used for this demonstration, feel free to use an adapt as necessary:
Source files
For my upcoming Blog I am going to show how to make an interactive progress / risk visualization bar in Survey123! Here is a sneak peek of the end result: