MAP SERIES
Over the coming months, I’m planning on developing a map series to showcase often overlooked aspects of Cartography and GIS. The idea is to explore topical subject matter to create insightful and (hopefully) beautiful maps.
This is the first in the series.
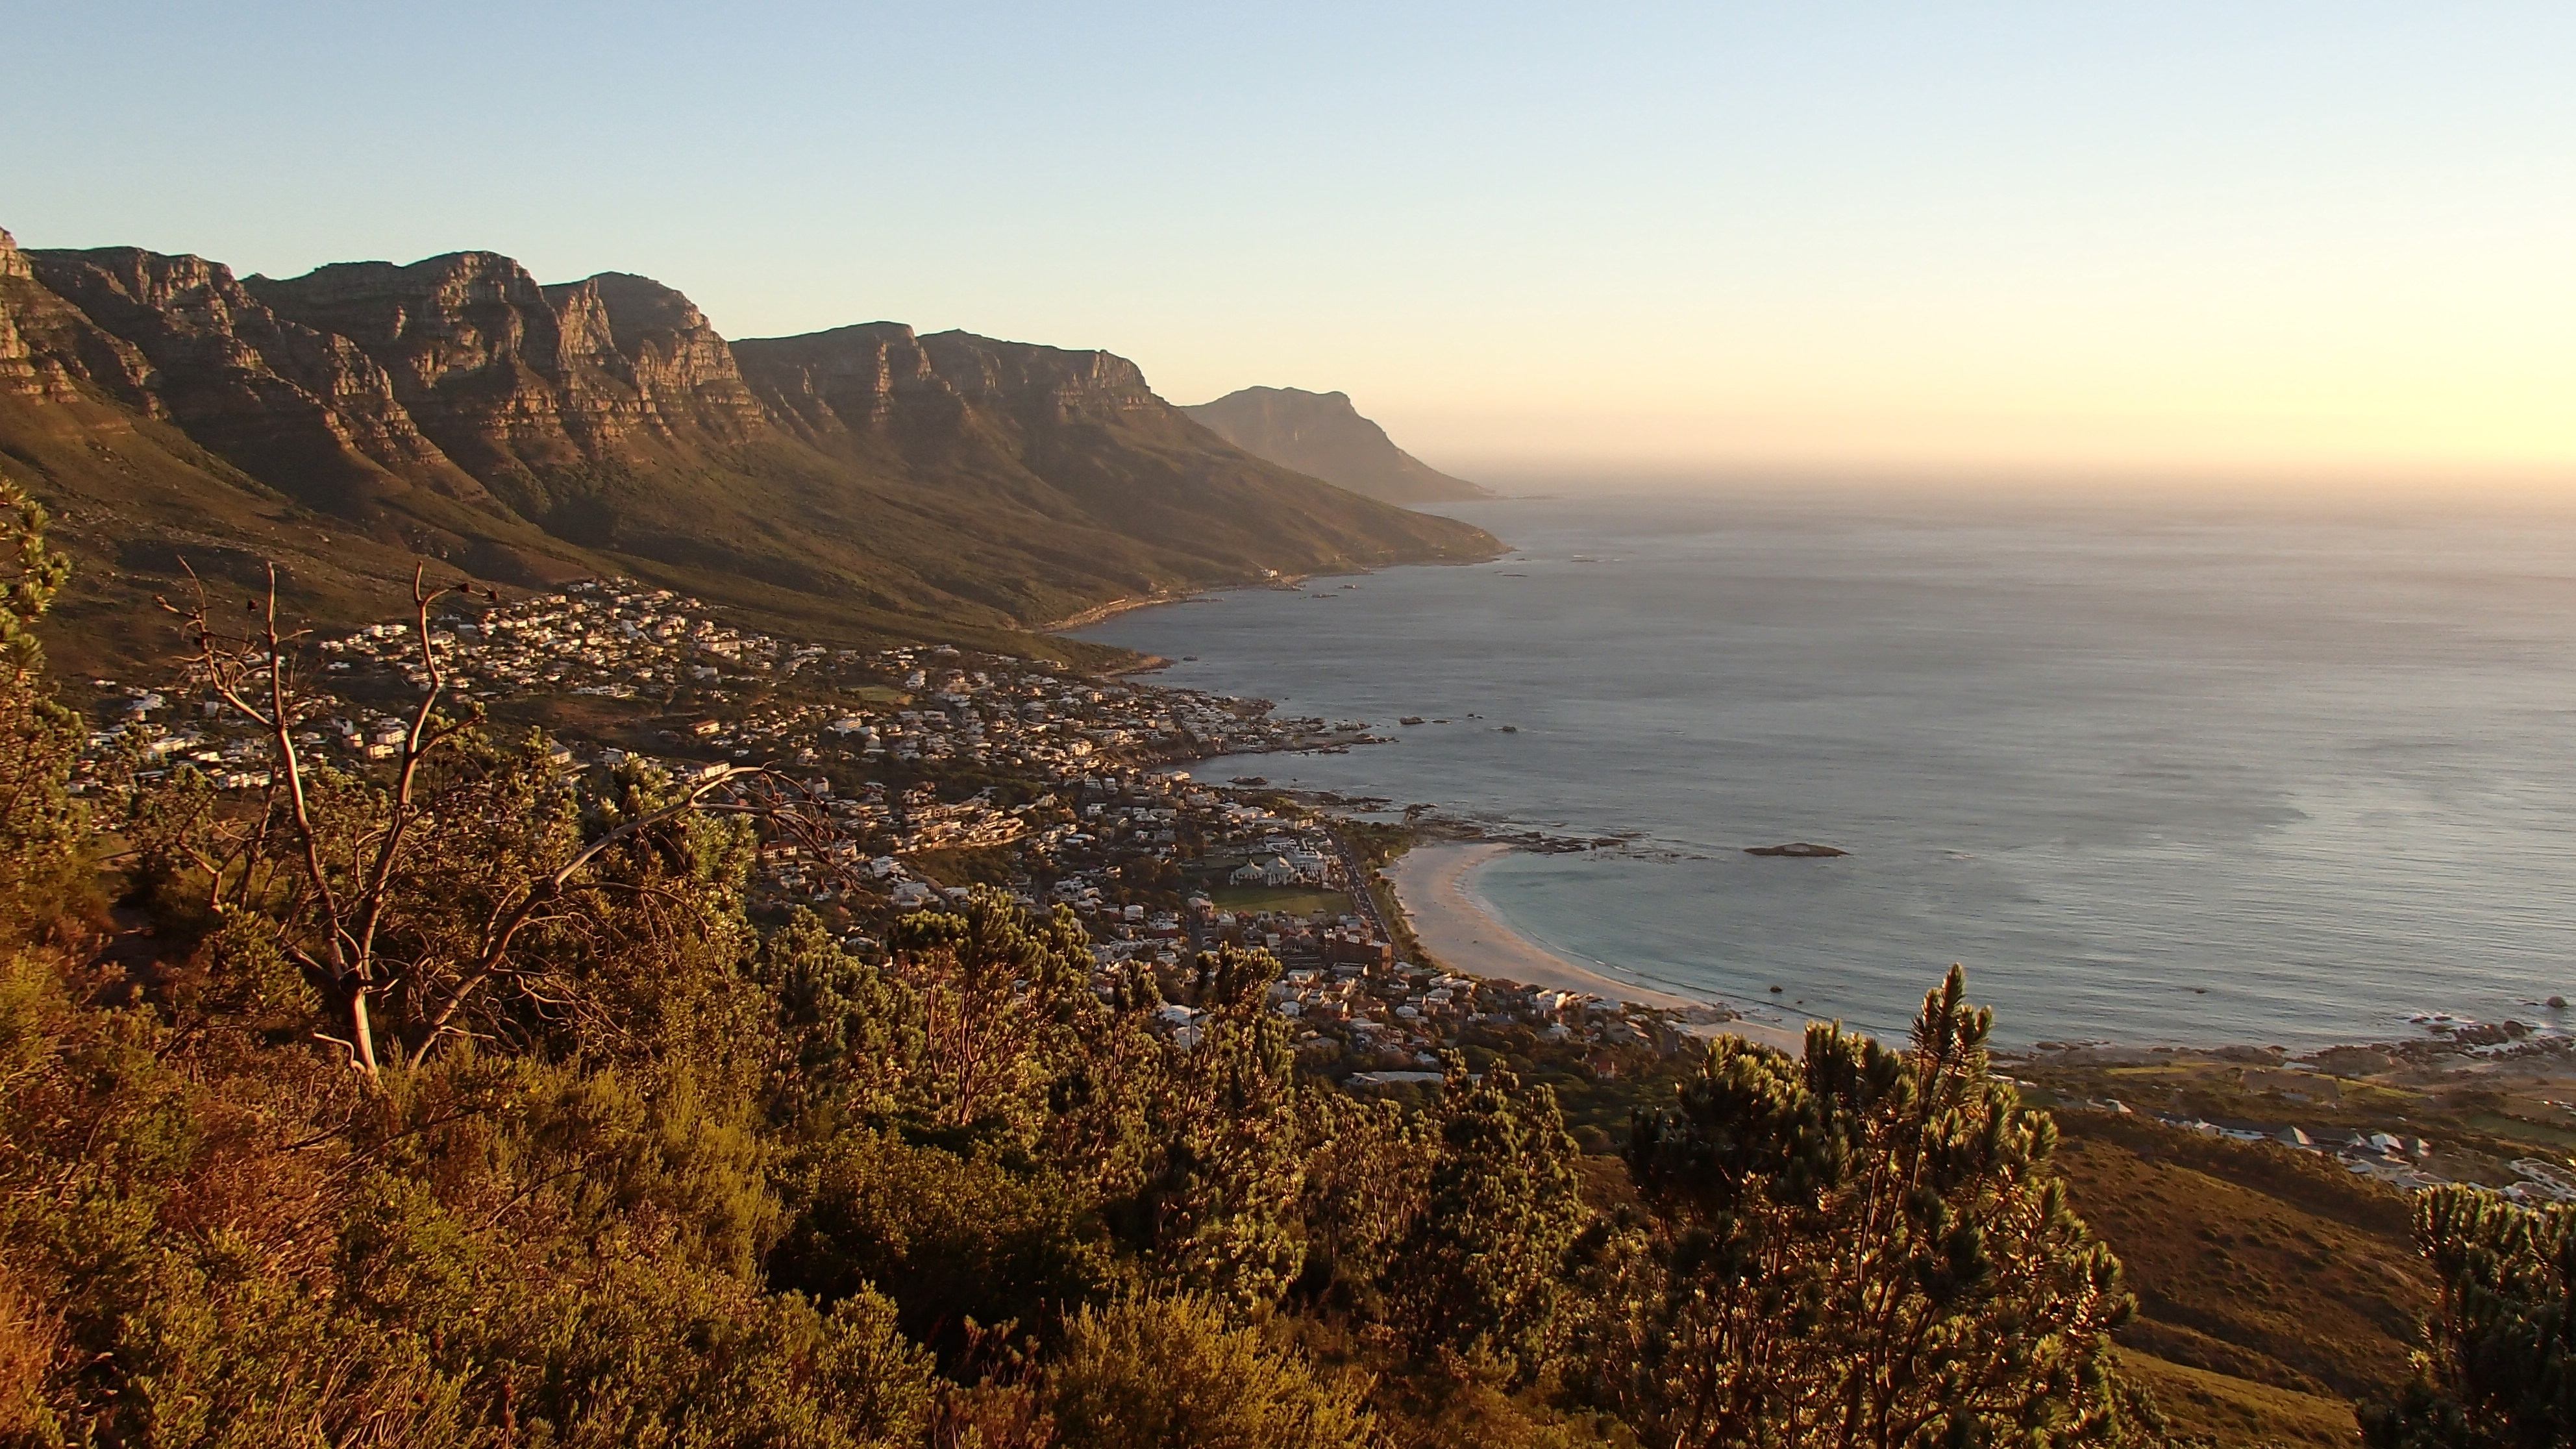
Every December hundreds of thousands of South African holiday-makers push pause on their lives and scatter across the country; making time to explore, relax and unwind.
I got to wondering if there would be a simple way of modelling this behaviour. Surely there must be some universal underlying factors that could be used to help explain where people go in December? I also knew I wanted to represent my data in a non-traditional way.
For the sake of simplicity, I limited my sights on South Africans moving within South Africa for the holiday season and eventually settled on four broad factors to consider:
- F1 [-] Distribution of population during the rest of the year
- F2 [+] Accessibility (using major roads as a proxy)
- F3 [+] Distribution of holiday accommodation
- F4 [+] Distribution of National Parks
There are obviously many more factors at play however these four seemed to interact spatially in a dynamic enough way across the country that I was happy to move forward with my investigation.
The density per factor was calculated per municipality, normalised across the country and combined into an equation that attempts to model the interaction between these factors as a linear function.
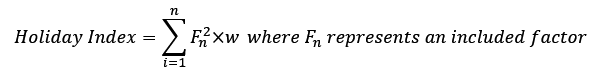
In the formula, population density acts as a push factor – people will be moving away from areas of high population density towards areas with low population density. The availability of accommodation, how accessible the area is and the distribution of national parks all act as pull factors.
The amount that each factor contributes towards the final index is controlled with weights and the global difference within each variable is exaggerated by squaring it’s normalised value to highlight the most favourable areas more clearly.
The final index can be used to rank order each municipality based on the likelihood that it will be visited in December by people who do not live in that region.
These values were then used to generate the following cartogram:
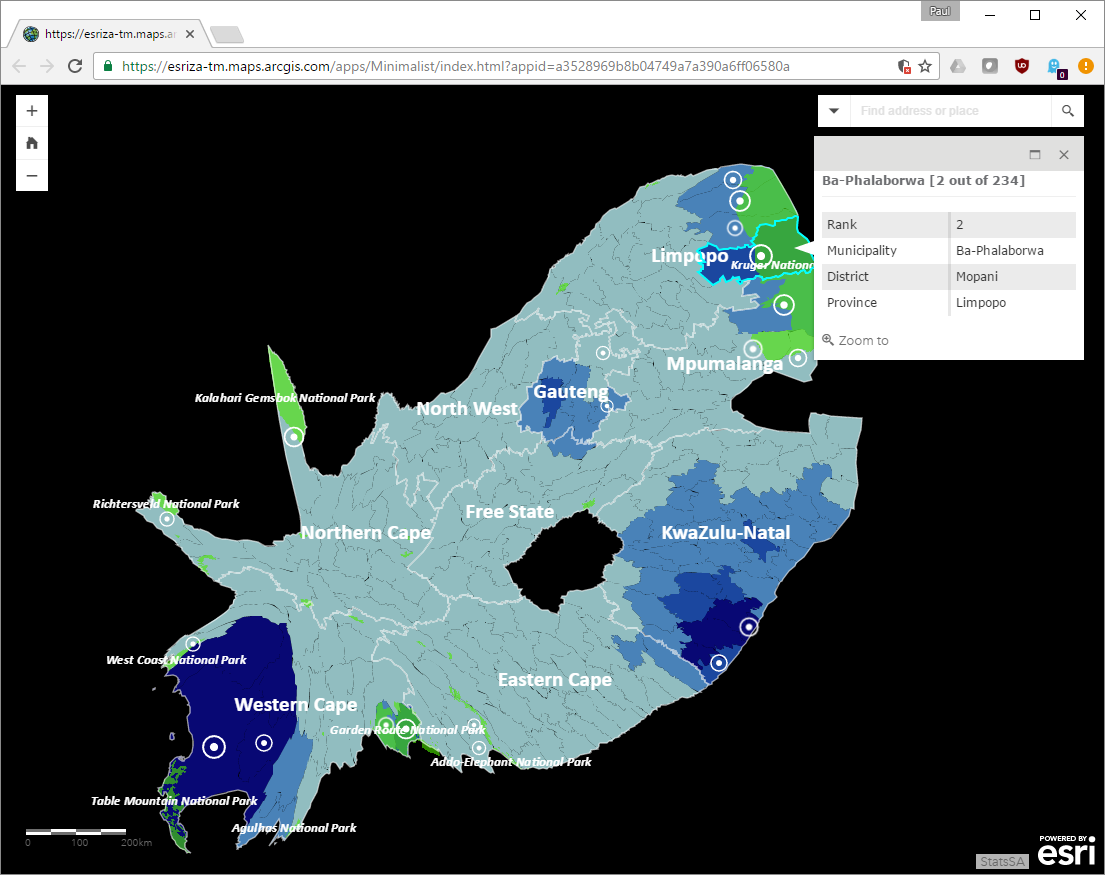
- You can explore the map right down to the municipal level
- The shades of blue represent the percentage change in surface area relative to the region’s usual size. This is affected by the rank as well as the relative difference in the ranks surrounding the area.
- National parks are included as well as major cities as you zoom in for context
- The top 20 sites are highlighted with the concentrically banded points
- Clicking anywhere on the map will return the overall rank for that region
Cartograms have been around since the 1800s. They provide us with a new perspective to our world by taking a thematic variable and typically substituting it for the area of the land that it represents.
The creation of cartograms comes with several challenges as regions must be scaled and still fit together. A recent (2004) and popular method of generating contiguous cartograms is the Gastner-Newman Method. This method is faster, conceptually simpler to understand and produces easily readable cartograms. The algorithm guarantees topology and general shape preservation (albeit with some distortion). This method allows its users to choose their own balance between good density equalization and low distortion of map regions, making it flexible for a wide variety of applications.
Now I need YOUR help.
Taking this one step further, I’ve configured a crowd sourcing web application which will allow users to post about their holiday destinations in a collaborative manner.
You will be able to access this from anywhere on any device and see information contributed by all users of the application. My hope with this is that this information will further support the outcome of the formula and cartogram produced in this exercise.
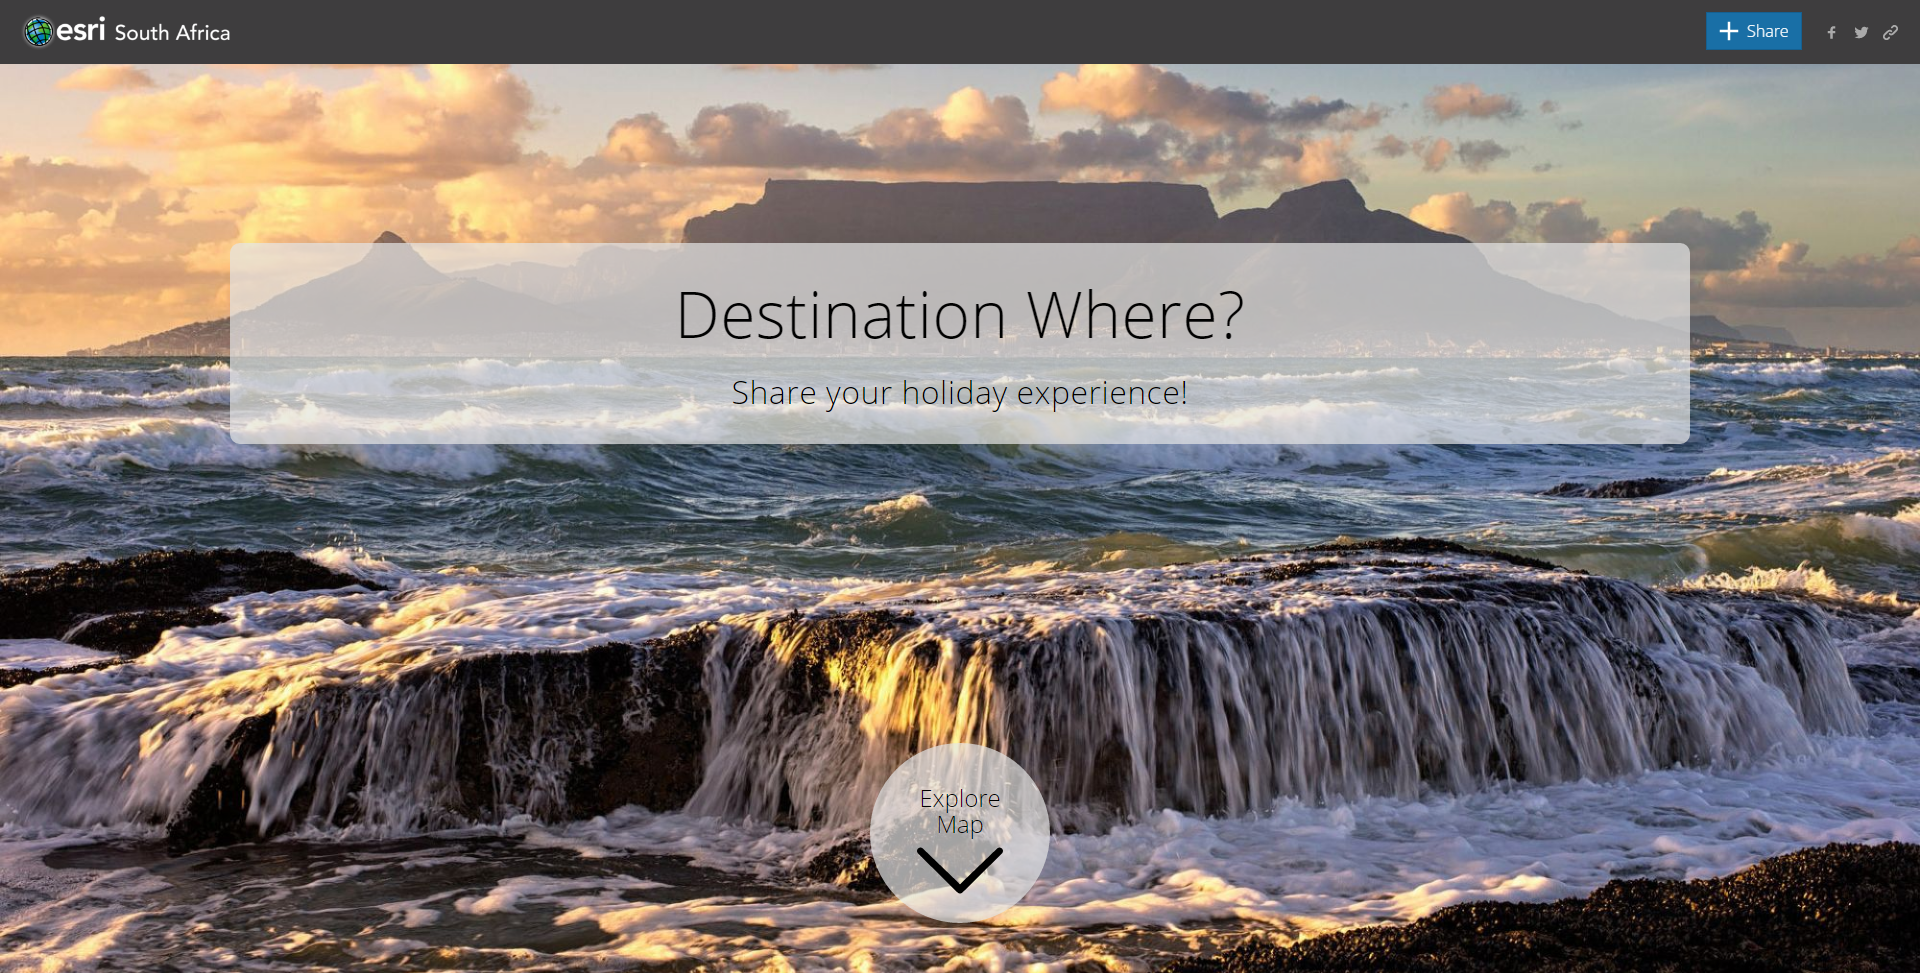
Please share far and wide and happy holidays!