With Esri’s ever expanding software stack it is sometimes difficult to keep track of the variety of software solutions available. One of the main areas of growth is Esri’s collection is its answer to 3D GIS. Fully utilising the extra dimension has come difficult to the GIS sector in the past (which is historically mostly two-dimensional in terms of application). Esri’s recent focus on developing a 3D stack which fully embraces three-dimensional analysis, content generation and visualisation with the emphasis on sharing 3D scenes with non-technical users has led to mainly two desktop applications, ArcGIS Pro and CityEngine. This blog post will have a look at both of these applications by discussing the capabilities and when to use them through a typical use-case for an area around central Johannesburg.

CityEngine or ArcGIS Pro
ArcGIS Pro:

ArcGIS Pro allows users to seamlessly integrate traditional two-dimensional GIS with 3D data in a single application interface. Using the 3D Analyst extension a user can perform various 3D analysis on GIS data including line of sight, volumetric calculations, viewshed calculations as well as working with LAS datasets, as well as the traditional GIS analysis methods like proximity, overlay and statistical analysis. For more information regarding the 3D Analyst extension visit: http://www.esri.com/software/arcgis/extensions/3danalyst.
The image below shows a Johannesburg scene showing 3D textured buildings, analytical representation of trees and extruded polygons showing the various zones and height restrictions of the buildings. This gives the user the ability to quickly see which building exceed their height restrictions.
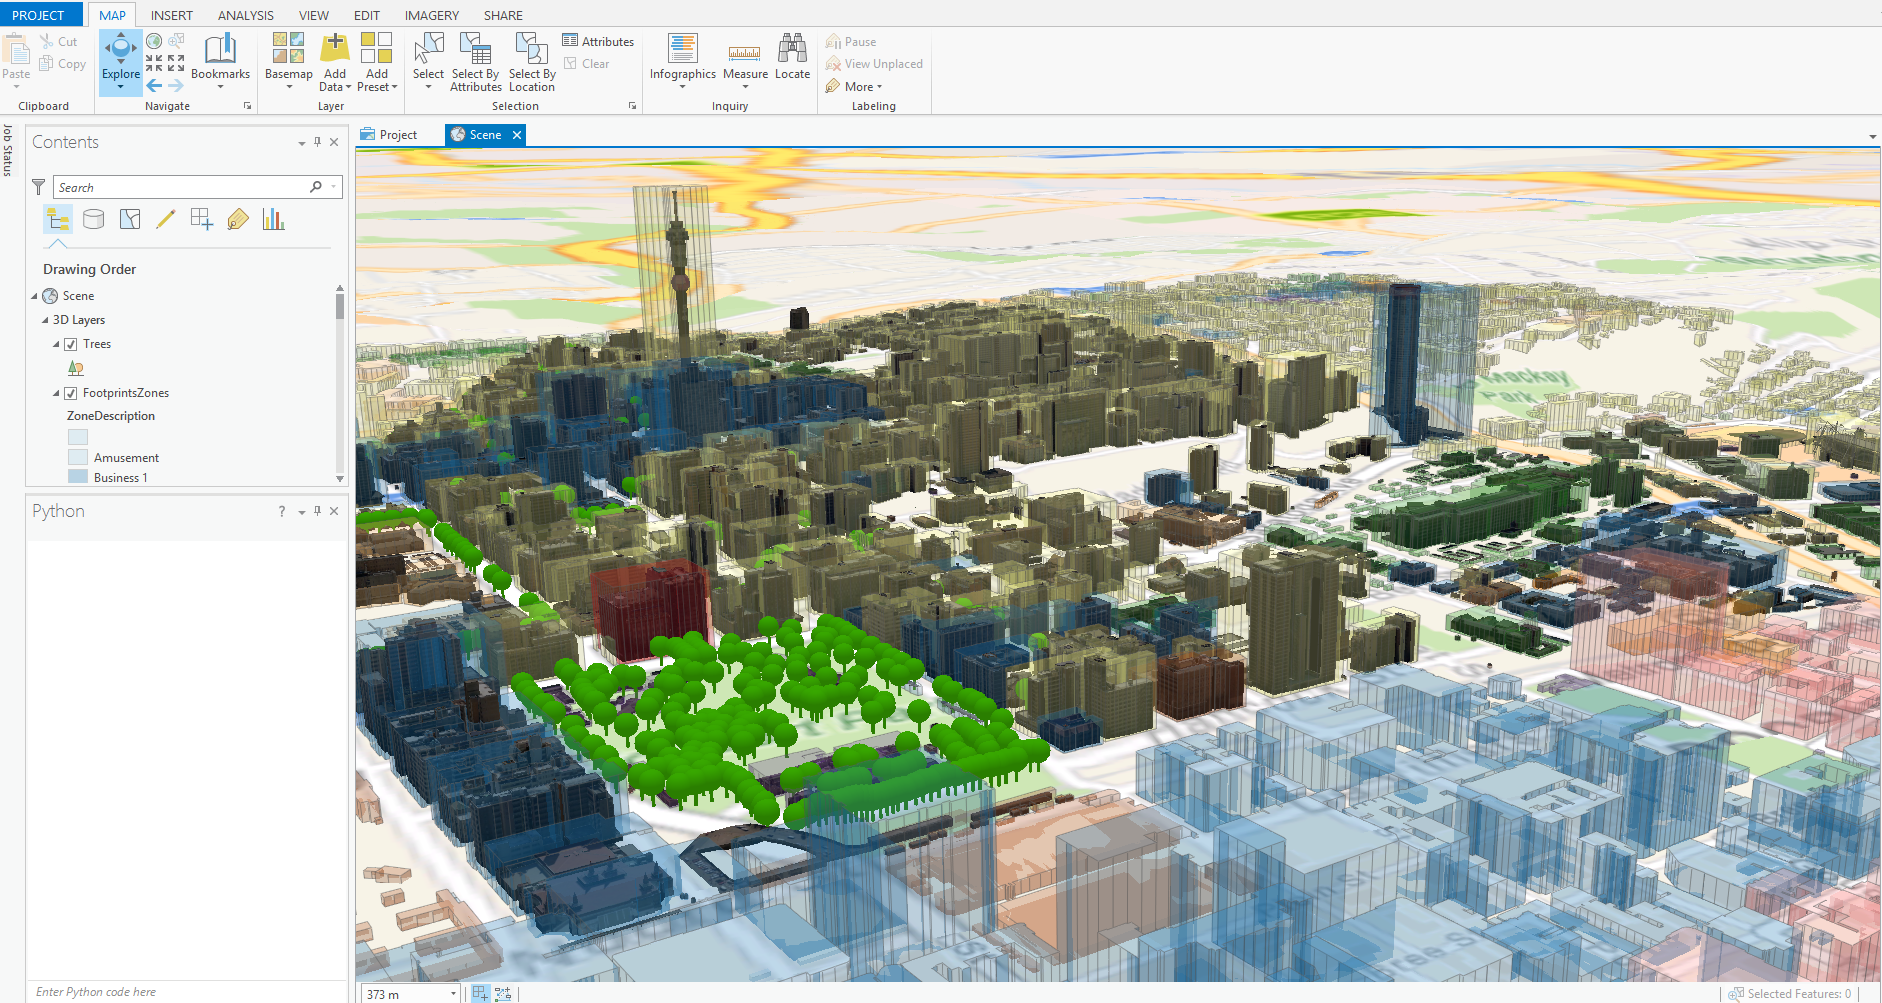
Overlay 3D buildings and zonal restrictions in ArcGIS Pro
Next we need to calculate how the shadows in the city change over course of a specific day, and share the result with external users.
Use the Sun Shadow Volume geoprocessing tool (3D Analyst) to calculate the shadow volumes. In the example below the analysis were done between 08:00 and 16:00 for every two hours.
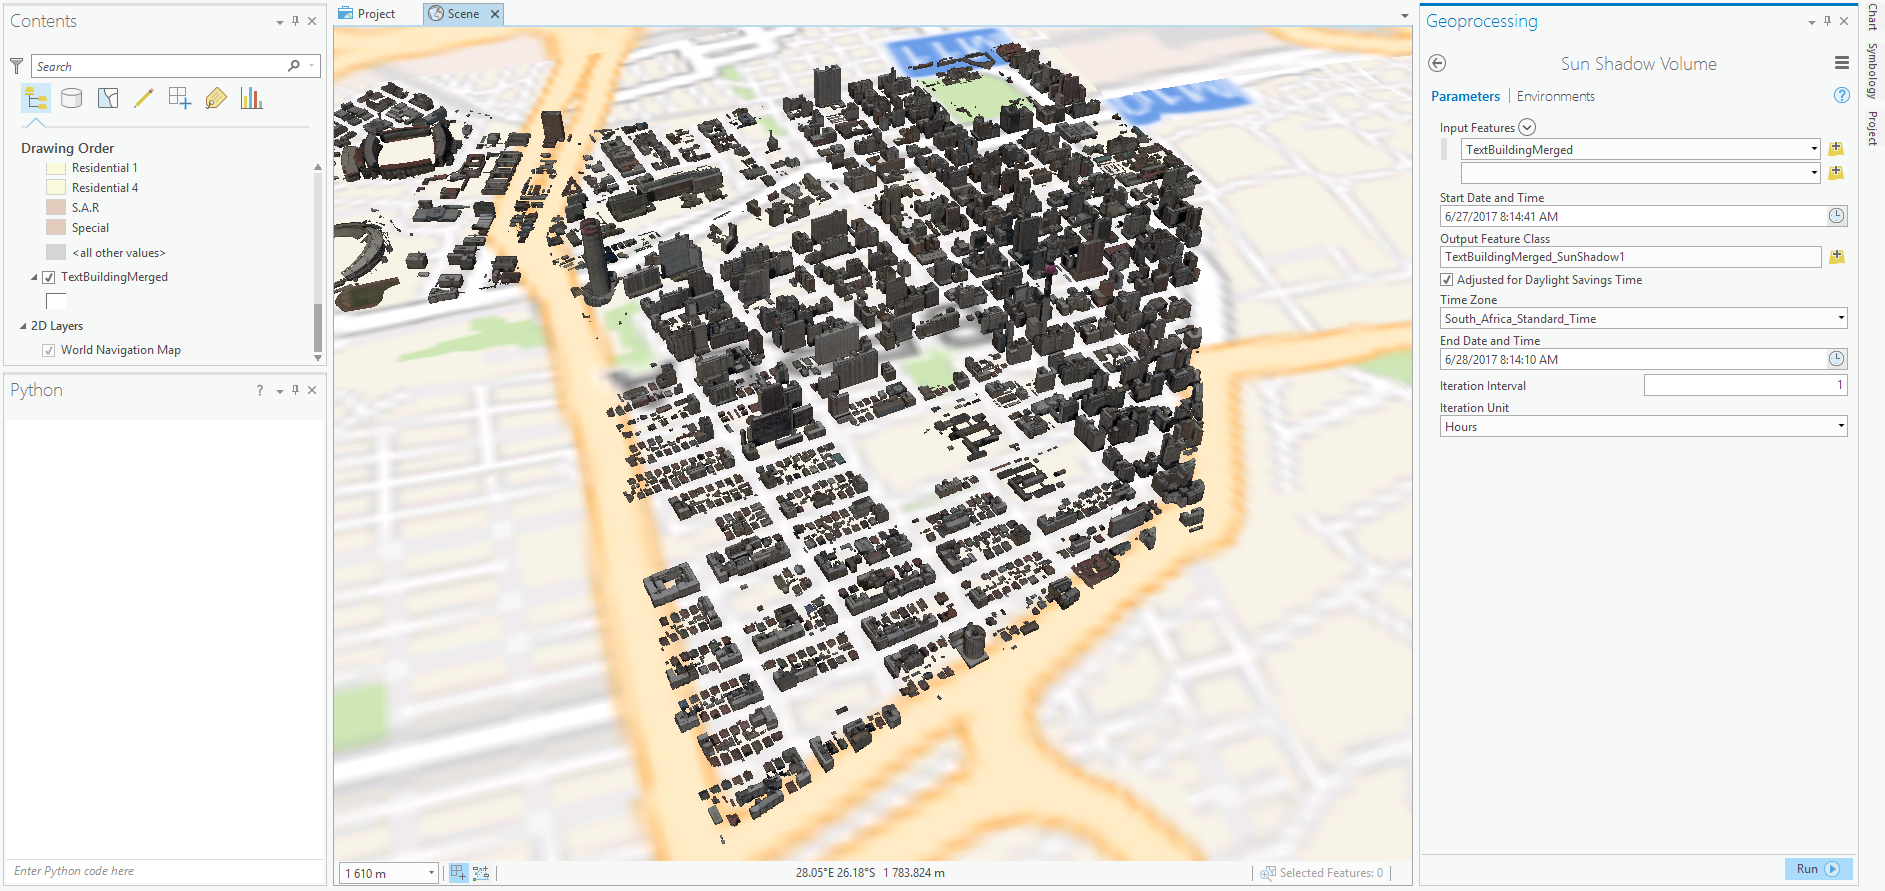
Sun shadow volume tool
The resulting multipatch represents the shadow volumes created by each building at a specific time. ArcGIS Pro has the ability to cycle through these time-enabled data to create a seamless animation of the shadow movement.
Shadow movement over the course of the day
Share the scene to either ArcGIS Online or Portal with ease. An example web scene for of the shadow analysis mentioned above can be viewed here.
*The next blog post will focus on the various 3D sharing techniques available in the ArcGIS Platform
ArcGIS Pro is a powerful tool for performing 3 dimensional analysis on GIS data. However, although ArcGIS Pro has 3D editing capabilities, its primary function is not 3D content creation. CityEngine on the other hand was designed especially for quick content generation on a large scale.
CityEngine:

CityEngine’s ability to dynamically create and compare urban scenarios quickly makes it a favourite among urban developers, local governmental authorities, township planners as well as the entertainment industry.
The key behind CityEngine’s quick content generation is its own procedural scripting language called CGA. These scripts or rules are basically a set of sequential tasks that guides the software to create accurate 3D geometries.
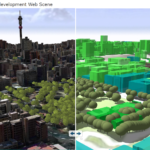
By applying different rules to the same datasets, we are able to generate various 3D representations. In the example below, we can see that in the larger view a more realistic scenario is generated displaying textured buildings and highly detailed trees. The inserted image shows the same datasets represented differently to produce a more analytical scenario of the data.
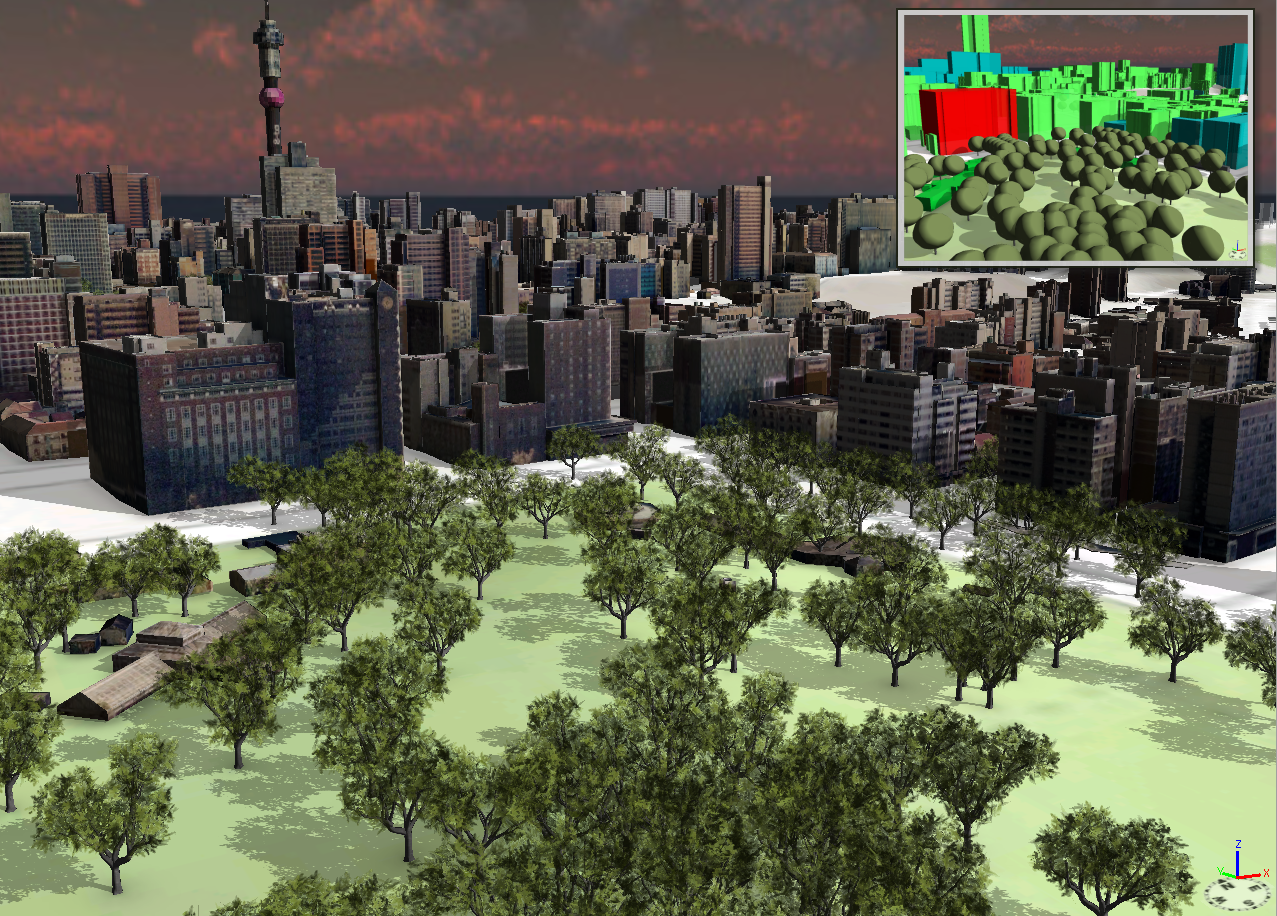
Using CGA rules creates multiple scenarios quickly using the same data
In another example, an urban designer might want to compare scenarios for a redevelopment project. In the image below CityEngine is used to compare high rising buildings, office spaces and apartment building designs.
Comparing redevelopment strategies in CityEngine
A CityEninge scene can be easily shared in a variety of ways. These include:
A CityEngine webscene is a static version of the CityEngine scene. All models, terrains and networks generated in CityEngine is compressed into a single .3ws file. This file can then be added as an item in ArcGIS Online or Portal, and when opened creates a browser based 3D environment that allows user-driven navigation and interaction. An example of the CityEngine web scene can be found here.
-
- Comparing Real world and Analytical representations

The image above shows examples of:
- comparing real-world and analytical scenes (top left)
- comparing redevelopment scenarios (top right)
- adding HTML embedded attributes such as Google Streetview (bottom)
Datasets can also be exported to a Scene layer package. A Scene layer package has the ability to publish hosted scene layers which represents 3D data as a feature service, when added to either ArcGIS Online or Portal.
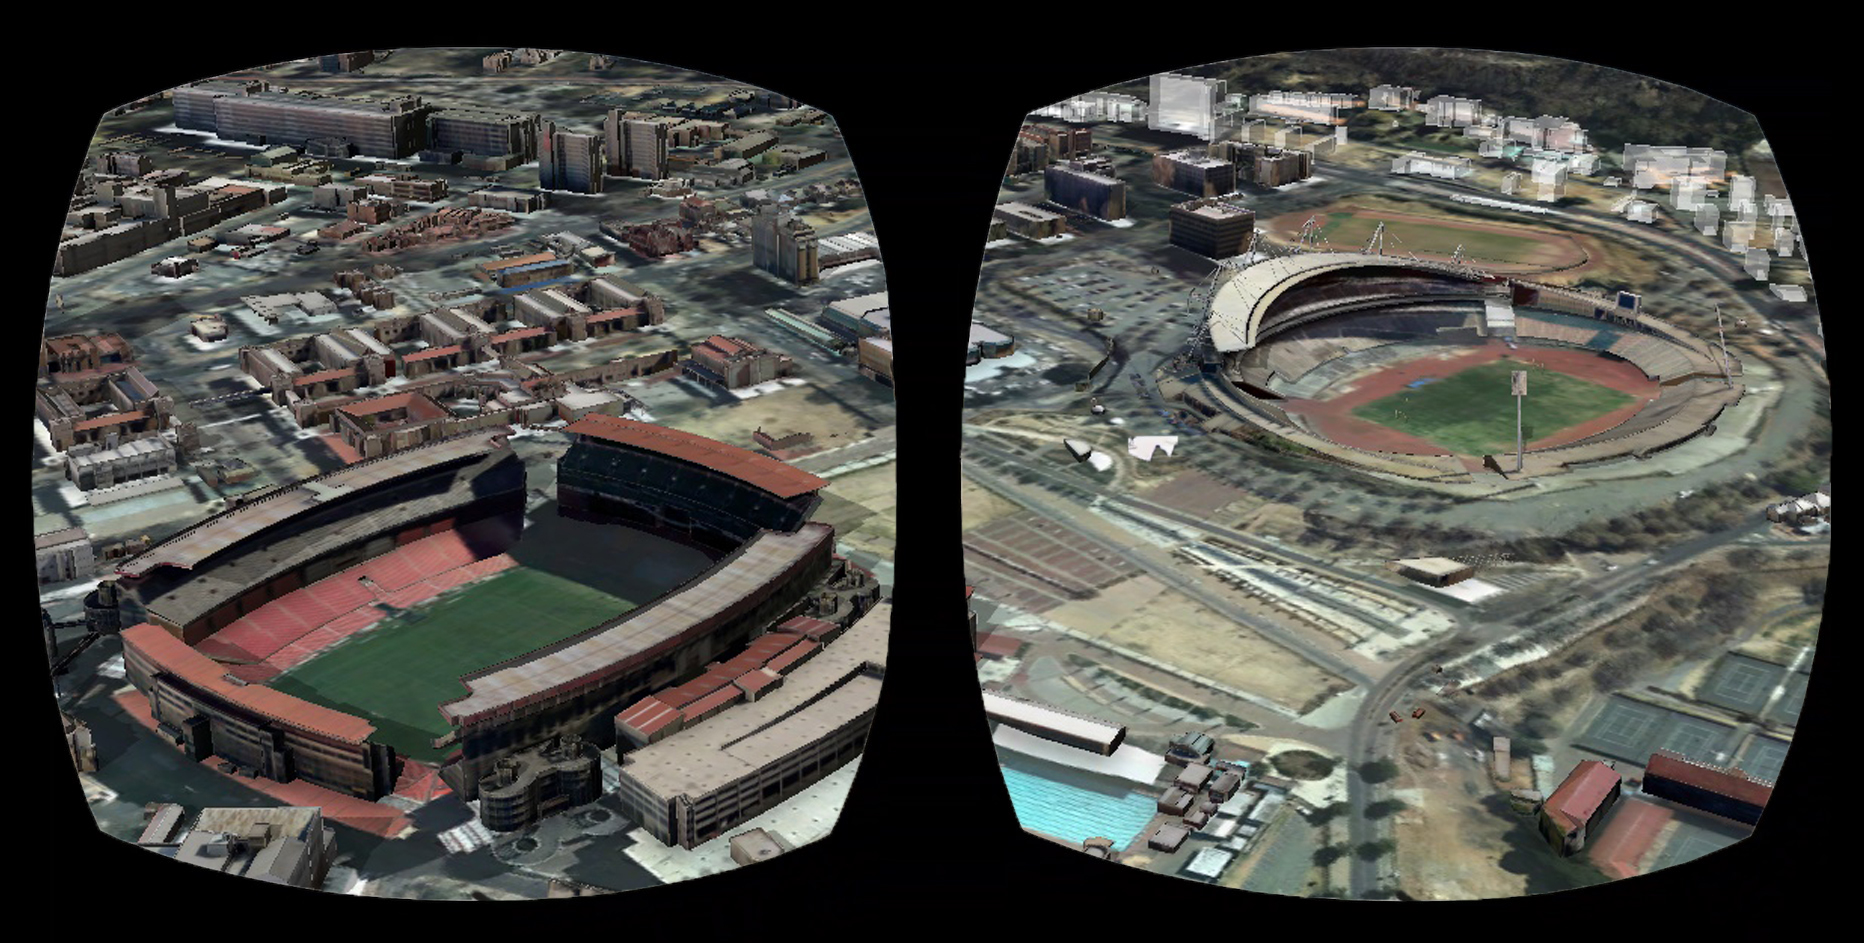
CityEngine also has the ability to share a scene as a 360 Virtual Reality experience. This creates a .3vr file which can be shared to ArcGIS online. Using a Samsung Gear VR headset along with the ArcGIS 360 VR app from Esri Labs, you are able to explore scenes in a fully immersive 3D virtual reality.
Find the Johannesburg 360 virtual reality scene here.
For more information about creating a 360 VR experience in CityEngine go to the Esri CityEngine Help.