Part of the Modelling Reality in 3D series
Often times there are problems that simply have to be solved in 3 dimensions in order to attain the appropriate results. This doesn’t have to be scary though! Through this series of blog posts – Modelling Reality in 3D, we’re going to uncover some simple and practical uses for 3D GIS.
In this demo we’ll be using tools that are nestled away in the Spatial Analyst extension and often overlooked in order to determine the production potential of rooftops of multipatch feature classes (Esri’s geometry type for 3D features) for generating electricity harnessing the power of the sun!
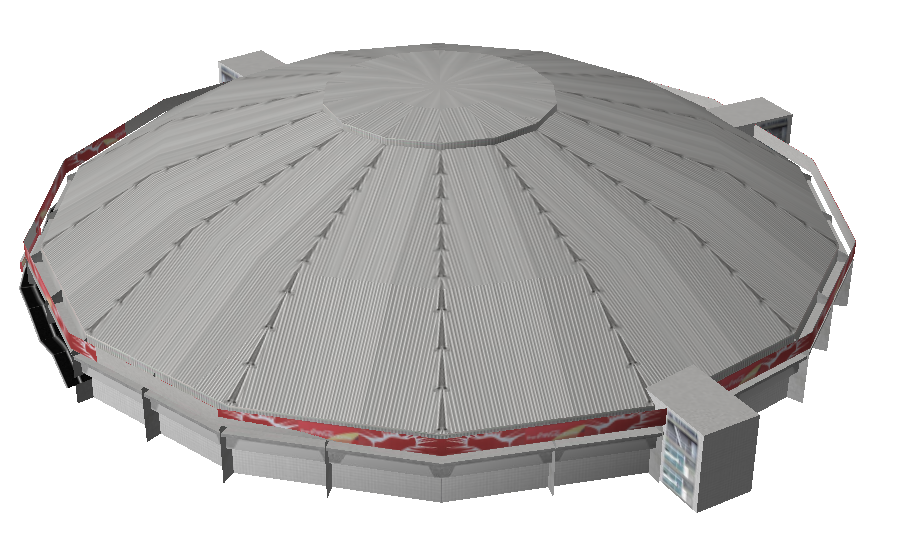
For this exercise we’ll be using a multipatch feature class from HERE’s 3D Landmark dataset of the Dome in Northgate, Randburg as its construction lends itself quite nicely to an exercise of this kind. This workflow should be perfectly acceptable to use on any other multipatches with a ‘roof’ area with minimal tweaking to the model as long as you keep in mind that this model assumes that skyward facing portions of the multipatch are rooftop areas.
The high level workflow and tools used for this exercise are as follows:
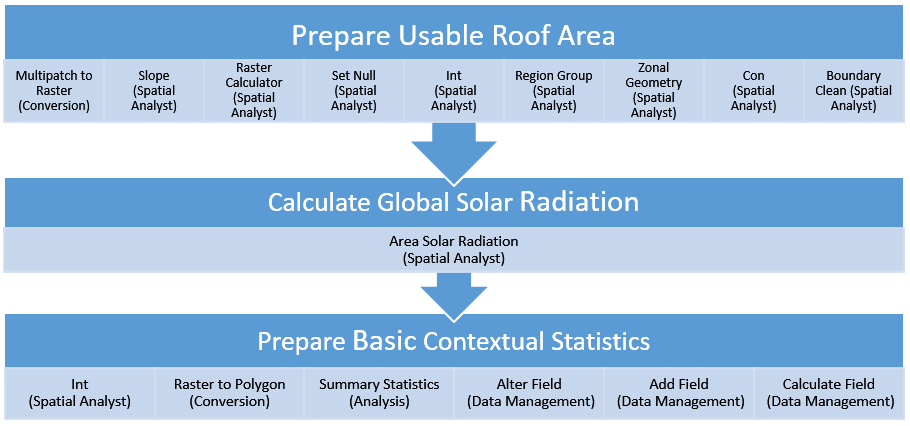
A toolbox can be downloaded HERE in which you can delve further into the parameters set for this demo. We will be discussing it on a conceptual level on the blog.
Prepare Usable Roof Area
This model will be calculating the maximum potential that can be harnessed by a rooftop, therefore we need to define what this region is. The Area Solar Radiation tool, which we’ll discuss later on, requires a DEM as input and provides results based on a square metre, so we know that this rooftop needs to be represented as a DEM and to make calculations easier later on we will be using 1 metre squared pixels.
Using the Slope and Raster Calculator tools from the Spatial Analyst Extension we extract all of the areas with a slope of 36 degrees or less – this gives us a good approximation of the rooftop area that could hold a photovoltaic cell – we then use a number of other raster-based tools from this extension to clean up the roof area we will be working with.

Using the rooftop area we then extract from the DEM of the building only the portions of the DEM that relate to the roof area that we require for our analysis.
Calculate Global Solar Radiation
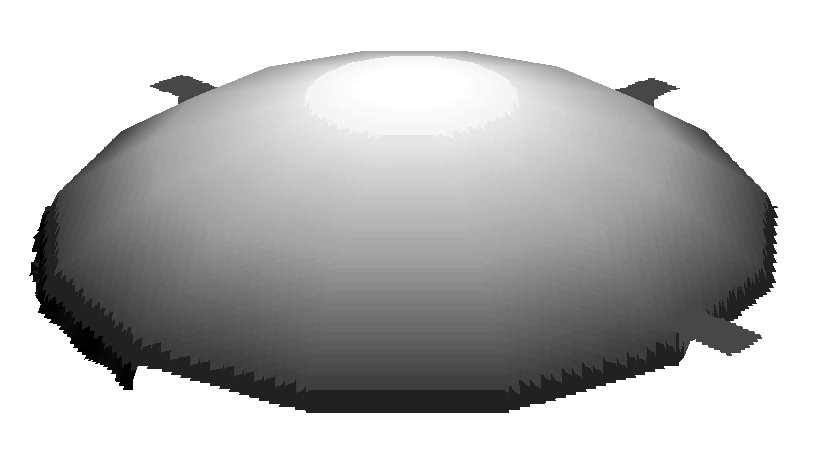
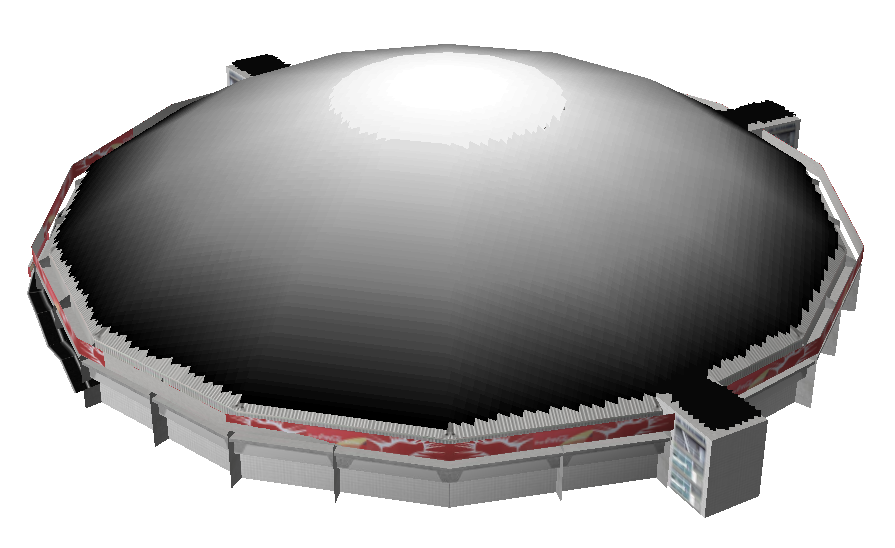
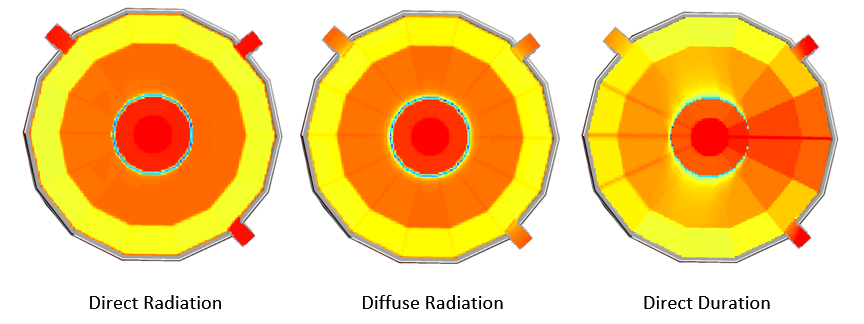
Using the Area Solar Radiation tool we determine the global radiation expected to hit the roof of this building in an entire year – this is a combination of both the direct and diffuse radiation and the pixel values have the unit of watt-hour per square metre. In this exercise I used all of the default values as they were well suited for the area in which this building lies, however you can change a number of parameters related to the amount of light that would eventually reach your rooftop.
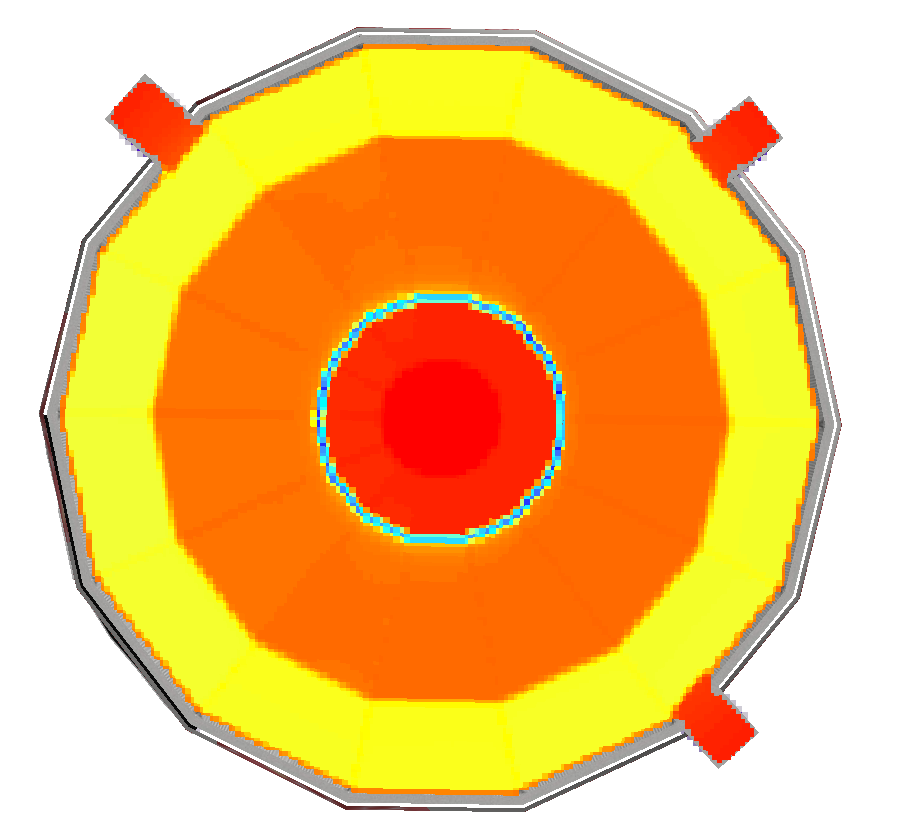
Additional outputs include views of both the direct and diffuse radiation which make up the global radiation as seen above as well as a DirectDuration ‘map’ which indicates in hours the amount of time each pixel would receive direct solar radiation.
Prepare Basic Contextual Statistics
Now that we have a result, we need to make sense of it and often times the best way to about this is by providing context. The following statistics were calculated based on the global solar radiation values.
|
Statistic |
Result |
Assumption |
|
Total Global Radiation |
3 192 297 067 wH |
Conditions modelled in the Area Solar Radiation Tool are correctly indicative of an average year for the site. |
|
Total Area |
21 189 m2 |
|
|
Solar Electricity Potential |
3 192 297 kWh |
|
|
Largest Possible System Cost |
R35 455 711 |
Based on a solar panel with the following specifications: Module Output: 310W Cost: R3246.86 per unit Size: 1.940352 m2 http://www.sustainable.co.za/jinko-jkm310p-310w-solar-panel-pallet-of-28.html |
|
Largest Possible System Size |
3 385 200 kW |
|
|
Solar System Potential |
4 077 473 kWh/year |
Based on a running time of 5 hours of maximum output for the largest possible system every day for a year with loss factors accounting for temperature (6%), dust (7%), wiring (5%) and DC/AC conversion (20%) |
|
Number of households that could be powered per month, either: |
||
|
Low Consumption |
680 |
500kWh per month |
|
Medium Consumption |
227 |
1500 kWh per month |
|
High Consumption |
113 |
3000 kWh per month |
Conclusion
Obviously this approach is based on a number of assumptions which would be made clearer on a true project of this nature and scale. A number of factors have also been disregarded such as the weight of the system and how much load the roof structure could bare. What this model does do is quickly provide an indication of the potential of rooftop-based solar energy in South Africa and hopefully showcases both the power of tools within our software within a 3D context!