Flood Risk Potential with Cyclone Idai
by Sean Cullen
With the recent Tropical Cyclone Idai making land fall in Mozambique on the 15th of March 2019, severe flooding followed, affecting large areas around Beira.
Using Sentinel-1 Synthetic Aperture Radar (SAR) imagery we can illustrate the areas flooded or covered with water, even when the affected area is still covered with clouds. Sentinel imagery is freely available from https://scihub.copernicus.eu/dhus/#/home. The Sentinel-1 imagery used to assess the effects of flooding for this event over Beira (Mozambique), was from Sentinel-1A for the 13th of March and Sentinel-1B for the 19th of March. Using this information in collaboration with ancillary data, Disaster response teams can effectively respond to flood related incidences and better coordinate rescue efforts.
One of the datasets could be the Flood Risk Potential product, developed by Esri South Africa, which simulates water level rise in natural drainage channels. The Flood Risk Potential was modeled using the JAXA ALOS 30m Digital Surface Model (DSM) dataset. The DSM was downloaded for the area of interest and applies hydrological tools to model water flow and the formation of natural drainage channels. This type of information is pertinent to Disaster Management teams before, during and after such flooding events. Before any flooding occurs, disaster management could plan potential evacuation or the location of potential rescue shelters and helicopter landing sites.
With the before and after satellite SAR images we can see what areas have changed and have been affected. Incorporating the Flood Risk Potential, we can see what areas may be affected later if the flooding had to get worse, or what areas may be accessible once the flooding starts subsiding. After the flooding, the model could be used to identify areas that require a change in land use or mitigation measures.
When looking at the extent of flooding using SAR data and overlaying the Flood Risk Potential data, there was a direct correlation to the areas that were flooded and where the model had suggested flooding may take place. This can be seen in the images below. The black points indicate building structures as extracted from Maxar (Digital Globe) imagery by EcopiaTech. This data was made available by Maxar in support of flood relief planning.
The 5 images below represent different datasets as they get overlaid with each other.
Image 1: The study area overlaid with the EcopiaTech Building Footprints.
Image 2: The streams layer from the Flood Risk Potential model, closely following clearly visible river channels.
Image 3: SAR data from Sentinel-1B from the 19th of March 2019 with a Vertical-Horizontal polarization. Dark blue illustrates areas that are covered by water.
Image 4: This is the one- and two-meter water rise simulations. Dark green represents the one meter and light green the two-meter water level rise simulation.
Image 5: This map shows the overlay of the Flood Risk Potential, SAR and EcopiaTech data. The areas with the darkest shading represent where flooding actually took place from the SAR data and the Flooding model simulated water level rise from natural drainage lines. Where there is a black dot in a darkly shaded area, a dwelling was most likely affected by the flood that could have been warned beforehand.
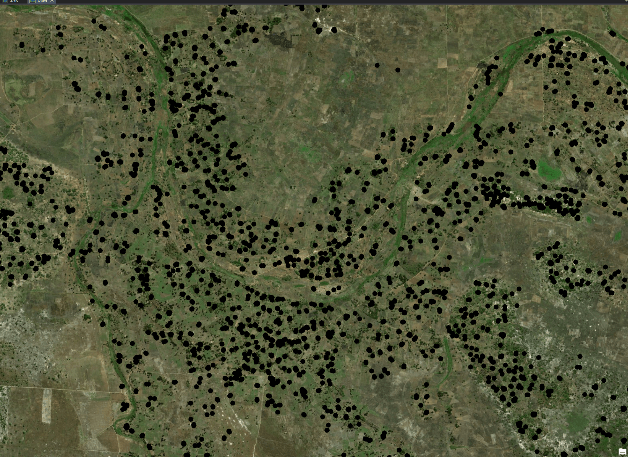
Image 1
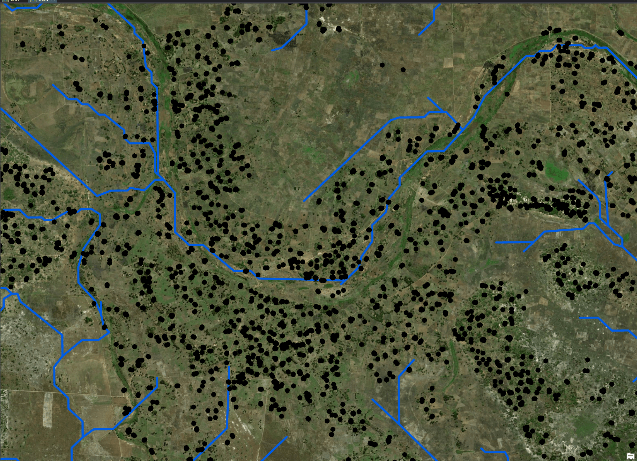
Image 2
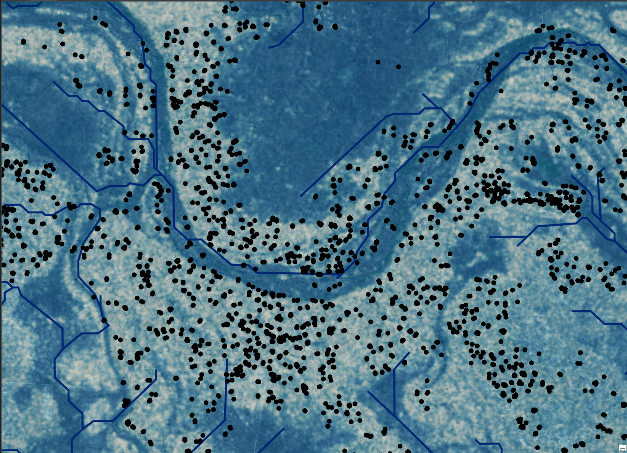
Image 3
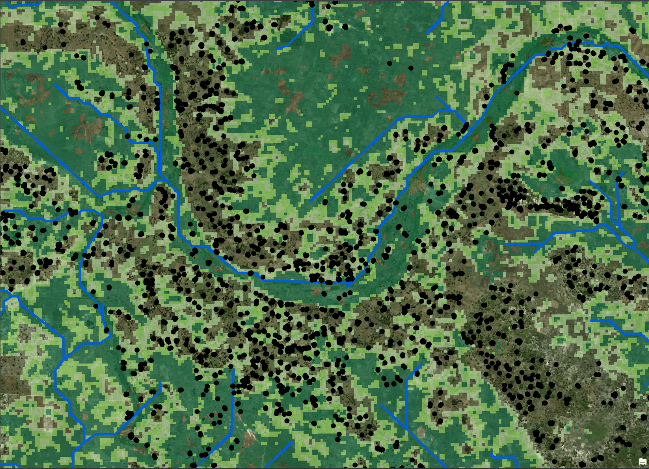
Image 4
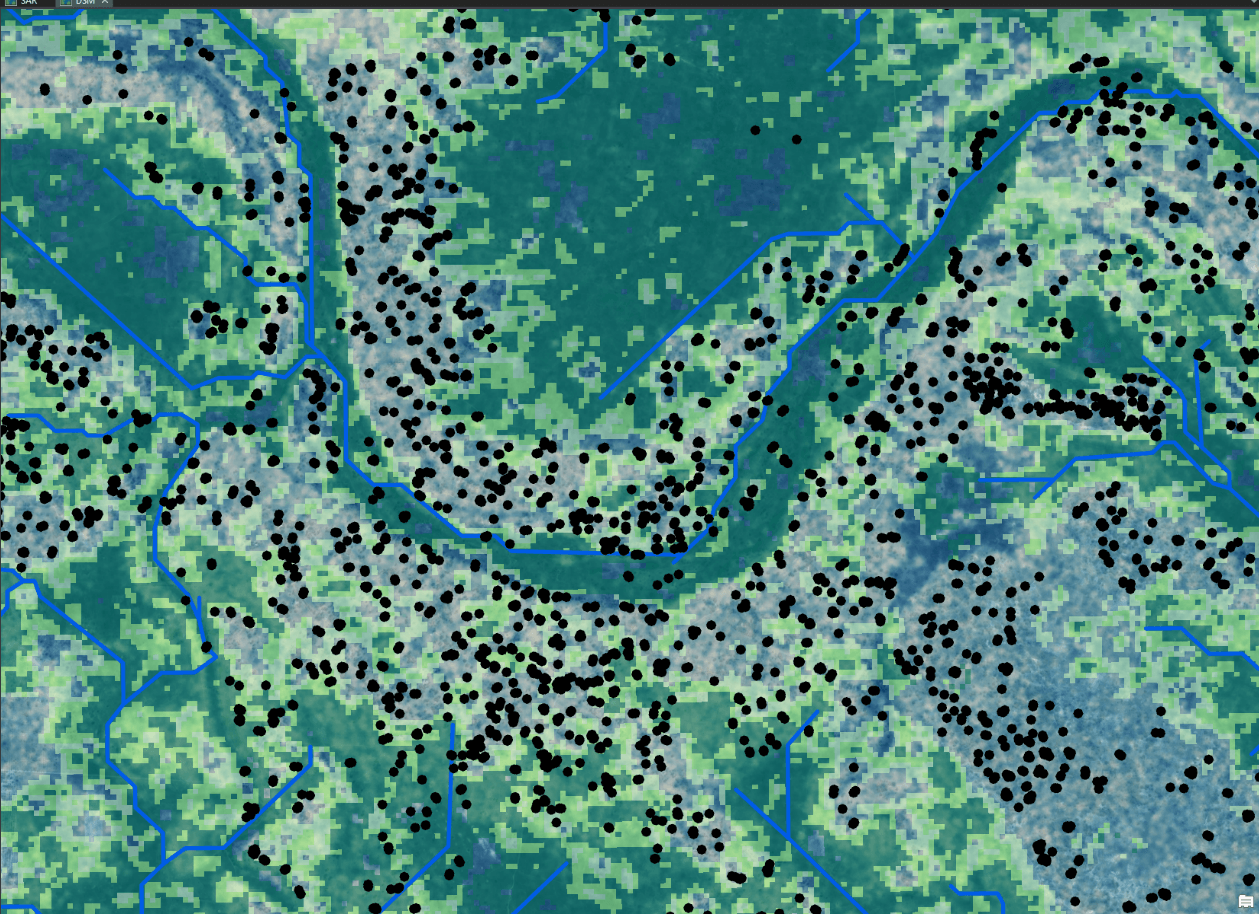
Image 5
Copernicus Sentinel data 2019, processed by ESA.
The SAR image from before Idai made landfall (13th of March) is available for download here: https://scihub.copernicus.eu/dhus/odata/v1/Products(’51fbc445-fcba-44b5-8d55-307dcfc6475e’)/$value
The second image after Idai made landfall (19th of March) is available for download here: https://scihub.copernicus.eu/dhus/odata/v1/Products(‘ba8aee87-7cfe-4661-b60c-37fbf7b2a6ce’)/$value
©Japan Aerospace Exploration Agency (JAXA), ALOS DSM
EcopiaTech, Ecopia
Esri South Africa Flood Risk Potential, Version 1.2 2019.